Comparing Any Two Time Periods in DAX
Reposted from Chris Webb's blog with the author's permission.
Simple time series calculations, such as comparing sales in the current year with the previous year, are easy to do in DAX and well-documented. What happens if, in PowerPivot or the SSAS 2012 Tabular model, you want to compare the sales in any two arbitrary time periods – for example you want to compare (and maybe find the growth from) sales in January last year and February this year?
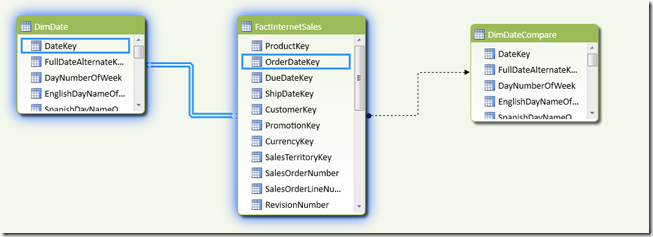
There are several ways of solving this, but here’s one. First, you need two Date dimension tables, one for each of the two time periods you’re comparing. Using the Adventure Works DW database here’s an example of how this can be done:
In this case I loaded DimDate and FactInternetSales and created an active relationship between the two tables on OrderDateKey=DateKey. I then loaded DimDate again, called it DimDateCompare, and created another relationship between it and FactInternetSales on OrderDateKey=DateKey but set this second relationship as inactive. This means that any selection on DimDateCompare will be ignored unless the relationship between it and FactInternetSales is activated using the UseRelationship() function.
You can then create a measure to get the Sum of the SalesAmount column for the selection on DimDate, which is simply:
Sum of Sales Amount:=SUM([SalesAmount])
Then create another measure that uses the relationship between DimDateCompare and FactInternetSales and ignores any selections on DimDate (to do this, you just need to use the All() function):
Sum of Sales Amount for Comparison Period:=
CALCULATE(
SUM([SalesAmount])
, ALL(DimDate)
, USERELATIONSHIP(FactInternetSales[OrderDateKey], DimDateCompare[DateKey]))
And finally create a measure to find the difference between these two measures:
Difference:=[Sum of Sales Amount] – [Sum of Sales Amount for Comparison Period]
To show how this works, look at the following PivotTable showing these three measures:
I have CalendarYear from DimDate on the rows of the PivotTable and CalendarYear from DimDateCompare on the Slicer. The Sum of Sales Amount measure shows, as you would expect, the sum of sales for each year on DimDate; the Sum of Sales Amount for Comparison Period ignores what’s on rows and returns the sum of sales for the two years selected on DimDateComparison, ie 2001 and 2002. This is £3,266,373.66 + £6,530,343.53 = £9,796,717.18; and Difference shows the second of these values subtracted from the first.
Not a very interesting calculation in itself perhaps, but I’m intrigued by the possibilities of having tables in the model that only have inactive relationships with other tables; up to now I’ve only used inactive relationships in scenarios where there have been another active relationship between the same two tables, for example as described in Kasper’s post here.
 |
Chris has been working with Microsoft BI tools since he started using beta 3 of OLAP Services back in the late 90s. Since then he has worked with Analysis Services in a number of roles (including three years spent with Microsoft Consulting Services) and he is now an independent consultant specialising in complex MDX, Analysis Services cube design and Analysis Services query performance problems. His company website can be found at http://www.crossjoin.co.uk and his blog can be found at http://cwebbbi.wordpress.com . |


