Q: In my source data I have daily balance values. How in PowerPivot for Excel can I create calculation that shows correct closing balance for year, quarter and month?
User Rating: 4 / 5


Q: In my source data I have daily balance values. How in PowerPivot for Excel can I create calculation that shows correct closing balance for year/quarter and month?
A: PowerPivot for Excel has DAX functions ClosingBalanceMonth, ClosingBalanceQuarter and ClosingBalanceYear that could help you implement this functionality.
Example: Lets build a report that shows trading stock closing value for the day, month, quarter and year. This report will contain data from 2 tables:
- Stocks - list of closing stock price for each day. Important fields are Stock_symbol, Date and ClosingValue.
- Date - list of date attributes. Important fields are Date, Month, Quarter and Year.
If you just drop ClosingValue field in the "Values" area, by default that value will be summed. This does not make sense at any level that is higher than a day. You can change fields aggregation type from "SUM" to "Average" and then at the higher level you'll be able to see stock average price for that month, quarter or year. This makes more sense, but still does not produce expected results.To get closing stock value for a month, year and quarter you will need to create calculated measure using DAX. Here is sample formula that will do this calculation:
=IF(CountRows(VALUES('Date'[Date])) = 1,SUMX(Stocks, Stocks[ClosingValue]),ClosingBalanceMonth(SUMX('stocks', 'stocks'[ClosingValue]), 'stocks'[date]))
In this calculation we first check count of rows for current date selection. If value is 1 then that means we need to calculate closing value for the day level. In this example we should expect that there might be more than one stock selected so we are returning SUM of stock values for day, month, quarter or year.
If there is more than one day for current calcualtion, that means this cell is calculated for a date dimension at the level that is higher than day level (for example month, quarter, year or ALL). In such case we can use ClosingBalanceMonth DAX function to get closing balance at the end of the month. Same function works well for quarter and month level, so in this case there is not need to use functions ClosingBalanceQuarter and ClosingBalanceYear. When we calculate Closing balance, we return SUM of stock closing values, as in the report user might have selected more than one stock to analyze. In such case we will return sum of stock values for specific day for selected stocks.
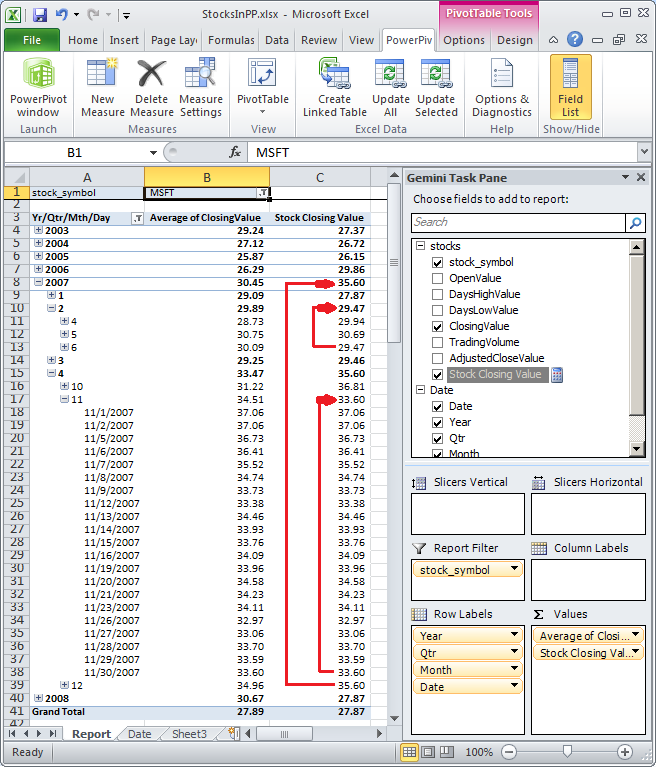
Here is screenshot of the report that shows correct stock value for day, month, quarter and year: