Controlling the Position of Subtotals in DAX with GenerateAll()
Reposted from Chris Webb's blog with the author's permission.
Today I’m teaching the SSAS 2012 Tabular workshop with Alberto Ferrari in Belgium, and an interesting question came up during my session on DAX queries to do with subtotals that I couldn’t answer immediately. However, I found a solution fairly quickly afterwards and so I thought it was worth blogging about – especially since I think it’s a better solution than the one that Alberto knew about already!
Consider this DAX query that runs on a table sourced from the DimDate table in Adventure Works:
evaluate
summarize(
DimDate
, DimDate[CalendarYear]
, rollup(DimDate[DayNumberOfWeek])
, "Number of Days"
, countrows(DimDate)
)
It returns the number of Days in the table by calendar year and day number of week – it’s very similar to a basic GROUP BY query in SQL. I blogged about this use of Summarize() and Rollup() last year here.
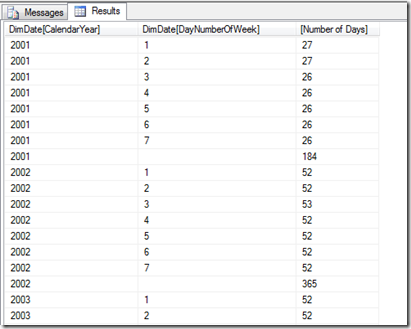
The problem with this query is that all of the year subtotals (which appear as rows with blank values returned in the day number of week column) created by this query appear at the end of the result set, as you can see here:
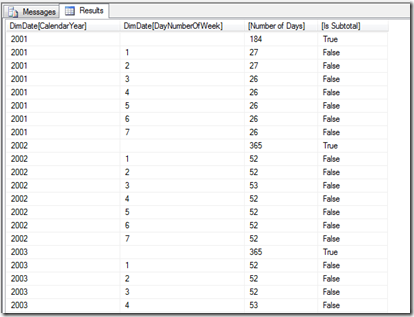
This isn’t very clear though. How can we put each year’s subtotal at the end of the distinct list of day numbers instead? Alberto’s solution (and I think this is the solution we’ve got in our new SSAS 2012 Tabular book) involves using the IsSubtotal() function (see here for more details on this) and ordering, similar to this:
evaluate
summarize(
DimDate
, DimDate[CalendarYear]
, rollup(DimDate[DayNumberOfWeek])
, "Number of Days"
, countrows(DimDate)
, "Is Subtotal"
, IsSubtotal(DimDate[DayNumberOfWeek])
)
order by
DimDate[CalendarYear] ASC
, DimDate[DayNumberOfWeek] ASC
, [Is Subtotal] ASC
But I thought there was an alternative, more elegant approach and found one. Here it is:
evaluate
generateall(
values(DimDate[CalendarYear])
,
summarize(
DimDate
, rollup(DimDate[DayNumberOfWeek])
, "Number of Days"
, calculate(countrows(DimDate))
)
)
As you can see, the subtotals appear after the list of day numbers for each year. There are two important things to understand about how this query works:
- I’m using the GenerateAll() function to take the list of distinct years returned by the Values() function and then, for each year, return a table of day numbers with a subtotal and crossjoin the result. This gives us our subtotals in the correct position without any sorting required.
- I had to wrap my original countrows() with calculate to make sure it returned the correct value.
 |
Chris has been working with Microsoft BI tools since he started using beta 3 of OLAP Services back in the late 90s. Since then he has worked with Analysis Services in a number of roles (including three years spent with Microsoft Consulting Services) and he is now an independent consultant specialising in complex MDX, Analysis Services cube design and Analysis Services query performance problems. His company website can be found at http://www.crossjoin.co.uk and his blog can be found at http://cwebbbi.wordpress.com . |


