OR Selections in DAX
Reposted from Chris Webb's blog with the authors permission.
Most of the time, selecting items in a PivotTable in a PowerPivot or SSAS 2012 Tabular model works in the way you want: if you select more than one item from a column it acts as an OR filter on that column; selecting items on another column acts as an AND filter on the selection. Consider a simple PowerPivot model built from the following Excel tables (where the only relationship is on the FruitKey columns):
With a measure that sums up the Sales column, such as:
Sum of Sales:=SUM(SalesFact[Sales])
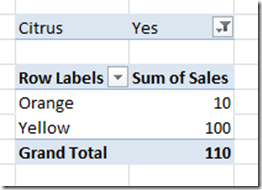
You can built a PivotTable like the one below that shows the sales of Citrus fruit that are Orange or Yellow (Citrus=Yes and (Colour=Orange OR Colour=Yellow):
So far so good. What happens if you want to see the sales of fruit that are either Citrus OR Yellow? If you know the selection in advance, or you have control over how your DAX is generated, you can build an expression like this measure that does the job:
Sum of Sales Citrus or Yellow:=
CALCULATE(
SUM(SalesFact[Sales])
, FILTER(ALL(Fruit1), Fruit1[Citrus]="Yes" || Fruit1[Colour]="Yellow")
)
But what if you don’t want to hard-code the filter you’re using, and want to let your users control what they are ORing? Here’s how…
First of all, you need to have two identical tables in your model that allow the user to make selections for the two conditions they are ORing. Here’s an example with the data from above:
Here I’ve got two tables, Fruit1 and Fruit2, for controlling the OR selection; only Fruit1 has a relationship with SalesFact though. Next, you need a measure that will apply the OR filter. The way this needs to work is as follows: take the whole of the Fruit table and if the user has selected something on Fruit1 then allow those rows through, and if the user has selected something on Fruit2 then allow those rows through the filter as well. Here’s the final DAX measure:
OR Sales:=
IF(
OR(ISCROSSFILTERED(Fruit1[FruitKey]), ISCROSSFILTERED(Fruit2[FruitKey]))
,CALCULATE(
SUM(SalesFact[Sales])
, FILTER(
ALL(Fruit1)
, IF(ISCROSSFILTERED(Fruit1[FruitKey]), CONTAINS(Fruit1, Fruit1[FruitKey], [FruitKey]), FALSE())
||
IF(ISCROSSFILTERED(Fruit2[FruitKey]), CONTAINS(Fruit2, Fruit2[FruitKey], [FruitKey]), FALSE())
)
)
, SUM(SalesFact[Sales])
)
The key points here are (starting from the inside of the expression and working outwards):
- I’m using ALL(Fruit1) to get all the rows from the Fruit1 table, regardless of what has been selected, and then passing that table to the FILTER() function
- I’m then using the ISCROSSFILTERED() function on the FruitKey columns on both tables to see if the user has selected anything from any columns on those tables; if they have, then the FruitKey column will be filtered in some way
- Then, if something has been selected on either table, in my filter of ALL(Fruit1) I’m allowing a row to pass through the filter if the value of FruitKey is present in the user-selections on Fruit1 or Fruit2. This preserves the original selection on Fruit1 and adds the selection on Fruit2 to it. It would be much easier to do this if there was a way of unioning table expressions in DAX!
- Finally, I’m using the resulting table in the CALCULATE() function to get the sum of Sales for that selection. If nothing has been selected, however, the outer IF() simply returns the sum of Sales Amount with none of this logic applied.
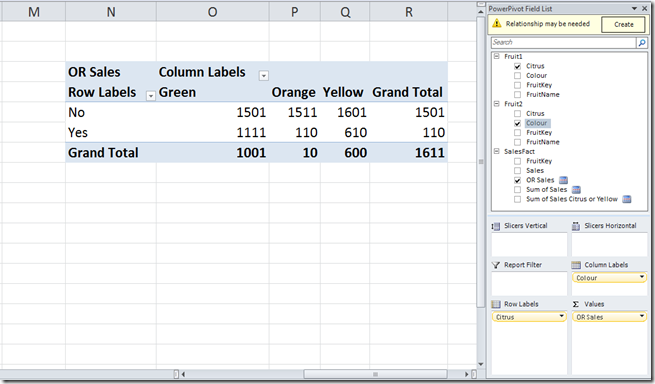
Here’s a PivotTable using this measure with Citrus from Fruit1 on rows and Colour from Fruit2 on columns:
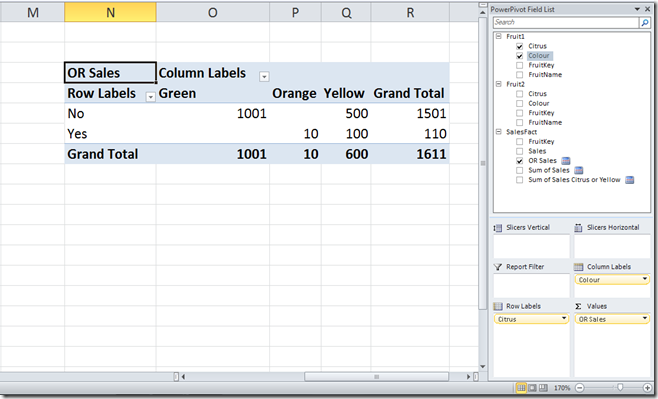
And, if you don’t want this OR functionality, all you need to do is ignore the Fruit2 table. Here’s a PivotTable with Citrus and Colour from Fruit1 on rows and columns:
I’m not sure this is the most elegant solution to this problem… if I think of one I’ll blog about it, and if you can think of one then please leave a comment!
 |
Chris has been working with Microsoft BI tools since he started using beta 3 of OLAP Services back in the late 90s. Since then he has worked with Analysis Services in a number of roles (including three years spent with Microsoft Consulting Services) and he is now an independent consultant specialising in complex MDX, Analysis Services cube design and Analysis Services query performance problems. His company website can be found at http://www.crossjoin.co.uk and his blog can be found at http://cwebbbi.wordpress.com . |


