Simple Basket Analysis in DAX
Reposted from Chris Webb's blog with the author's permission.
Continuing the theme of finding the distinct number of customers who’ve done something specific, I’ve recently been having a go at implementing simple basket analysis in DAX. So, for example, as well as finding the distinct number of customers who bought Apples, we may also want to find the distinct number of customers who bought both Apples and Oranges, or even those who bought Apples and Oranges but not Cake.??
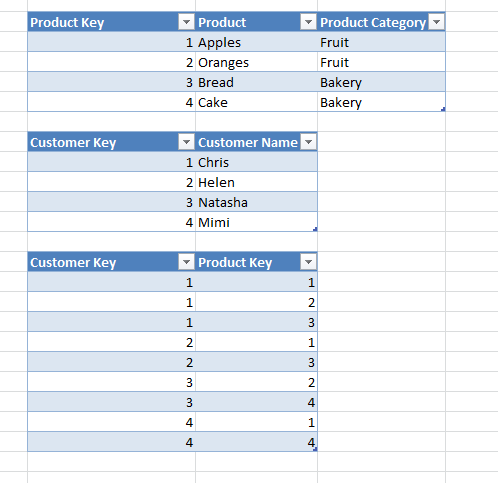
To illustrate this problem I used the following sample data entered into Excel tables as the basis for a PowerPivot model:
? ?
?
So what we have here is essentially a Product dimension table, a Customer dimension table and a Sales fact table. I did the obvious thing and set up relationships going from Sales to Product and Sales to Customer, but I also created two extra tables in PowerPivot that were built from the Product table: one to allow the selection of Products for the AND filter, and one to allow for the selection of Products in the NOT filter, neither of which were related to any other table. So when building the query to show the number of customers that bought Apples and Oranges but not Cake, the user would select Apples on the Product table, Oranges on the AND Product table and Cake on the NOT Product table.
The best and fastest way I found of writing the DAX I needed was to break the problem up into several smaller calculated measures. The starting point, to get the number of customers that bought Apples, is a simple calculated measure like this:
=COUNTROWS(DISTINCT(Sales[Customer Key]))
I then created two calculated measures: one that returned the distinct number of customers who had bought the AND Product, ignoring the selections made on Product and NOT Product; and one that returned the number of customers who had bought the NOT Product, ignoring the selections made on Product and AND Product. Here they are:
=CALCULATE(
COUNTROWS(DISTINCT(Sales[Customer Key]))
, FILTER(ALL(Product),
COUNTROWS(
FILTER(DISTINCT(‘Product Bought With’[And Product Key]), Product[Product Key] = ‘Product Bought With’[And Product Key]))
>0))
=CALCULATE(
COUNTROWS(DISTINCT(Sales[Customer Key]))
, FILTER(ALL(Product),
COUNTROWS(
FILTER(DISTINCT(‘Product Not Bought’[Not Product Key]), Product[Product Key] = ‘Product Not Bought’[Not Product Key]))
>0))
They both work in the same way: they find the distinct count but shift the context on the Product table (which has a relationship with Sales remember, whereas AND Product and NOT Product don’t) so that whatever has been selected on Product is ignored and, the selections made on AND Product and NOT Product are, respectively, used instead. To do this I’m using two nested filters – one which loops over every row in the Product table, and then an inner filter that loops over every selected member on AND/NOT Product; they return the rows from Product where the Product Key appears in the list of distinct Product Keys selected on AND/NOT Product.
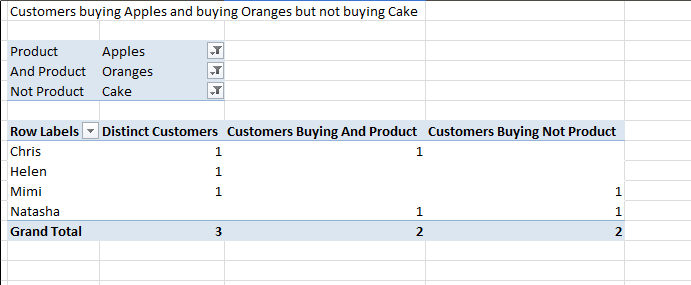
At this point we can build a pivot table that looks like this:
With Customers on rows, obviously, no distinct count is greater than 1, but we can now see that Chris, Helen and Mimi bought Apples; that Chris and Natasha bought Oranges; and that Mimi and Natasha bought Cake. We can now use these measures to create our calculated measure that returns the distinct number of customers that bought Apples and Oranges but did not buy Cake:
=CALCULATE(COUNTROWS(DISTINCT(Sales[Customer Key])), FILTER(DISTINCT(Sales[Customer Key]), [Customers Buying Not Product]=0 && [Customers Buying And Product]>0))
It’s a variation on the original distinct count measure, but now we’re using Calculate once again to shift the context so we take the distinct customers and apply an additional filter to ensure they didn’t buy whatever was selected on NOT Product but did buy whatever was selected on AND Product.
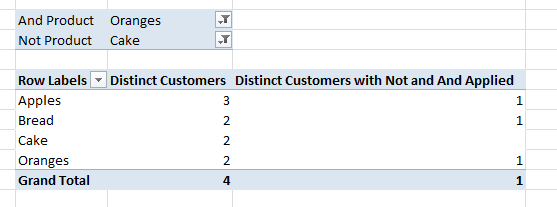
At last we can see that Chris was the only customer that bought Apples and Oranges but did not buy Cake. We can also run queries like this that don’t display individual customers:
There’s one last problem to solve: what happens if we don’t want to apply the AND or NOT filter for some queries? It doesn’t really make much sense to select the All member on either of these tables (for example, you’d never want to find the number of Customers that bought Apples and bought any Product and did not buy any Product) so we can alter the calculations to turn off the AND and NOT filter when the All member has been selected on either the AND or NOT Product table. Here are the new versions of the two calculated measures that return the distinct counts for the AND and NOT products:
=IF(
COUNTROWS(DISTINCT(‘Product Bought With’[And Product Key]))=COUNTROWS(ALL(‘Product Bought With’[And Product Key]))
, 1
, CALCULATE(
COUNTROWS(DISTINCT(Sales[Customer Key])),
FILTER(ALL(Product),
COUNTROWS(
FILTER(DISTINCT(‘Product Bought With’[And Product Key]), Product[Product Key] = ‘Product Bought With’[And Product Key]))
>0)))
=IF(
COUNTROWS(DISTINCT(‘Product Not Bought’[Not Product Key]))=COUNTROWS(ALL(‘Product Not Bought’[Not Product Key]))
, 0
, CALCULATE(
COUNTROWS(DISTINCT(Sales[Customer Key])),
FILTER(ALL(Product),
COUNTROWS(
FILTER(DISTINCT(‘Product Not Bought’[Not Product Key]), Product[Product Key] = ‘Product Not Bought’[Not Product Key]))
>0)))
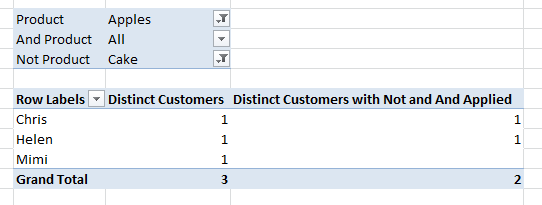
Here I’ve wrapped the previous expressions in an IF that checks if the number of distinct Product Keys in the selection matches the number of distinct Product Keys in the entire table – if it does then the All member has been selected, and the first expression then returns a 1 and the second returns a 0 to ensure that the filter conditions on these measures in the final calculated measure return true when the All member is selected. We can then run simpler queries like this one showing the customers who bought both Apples but not Cake, with no AND filter applied:
As always I’d be interested in hearing from anyone that’s got a better way of solving these problems. I’m aware I’ve used the evil Filter function all over the place and that that isn’t always good for performance (although on larger data sets this approach seemed to perform ok) so I wonder if there’s a way to avoid its use anywhere?
 |
Chris has been working with Microsoft BI tools since he started using beta 3 of OLAP Services back in the late 90s. Since then he has worked with Analysis Services in a number of roles (including three years spent with Microsoft Consulting Services) and he is now an independent consultant specialising in complex MDX, Analysis Services cube design and Analysis Services query performance problems. His company website can be found at http://www.crossjoin.co.uk and his blog can be found at http://cwebbbi.wordpress.com/ . |


