Measure Selection using Slicers in PowerPivot
Reposted from Jason Thomas blog with the author's permission.
As a Business Intelligence professional, I find it really fascin(/frustr)ating working with Excel users. You get exposed to a completely different way of thinking when you work with them, not to say that they are extremely smart and demanding. From the moment I started working with PowerPivot and interacting with Excel users, I knew it was not going to be easy tackling their questions and requirements. You simply cant escape by saying that the required feature is not available because they will push you till you find a workaround. This was the case when one of my users came back to me asking for a slicer which will dynamically help them to select the measures. I replied saying that the slicers are not intended for that purpose and should be used for filtering the data (and not for just selecting or deselecting values like Measures, which can be easily done from the Field List pane). However, the user pushed back saying that he would like to create a dashboard for the top management and didn’t want them to be using the Field List pane. That is when I had to put on my thinking cap.
For the purpose of this post, I am going to use some simple mocked up data which involves three measures (Sales, Quantity and Profit) for country and year.
Follow the steps below to recreate a slicer which can be used to select or deselect the measures in a pivot table:-
1) Create a table which will have the list of measure names needed in the slicer in the MeasureName column and their representative integer ids in the MsrId column. Import this table into PowerPivot using Linked Tables and name it as Msr.
There is no need to make any relations with the existing tables, and Msr table should be a standalone table.
2) Now make a new measure called MsrValue with the formula given below
MsrValue:=switch (TRUE,
Min ( Msr[MsrId] ) = 1,
Sum ( Fct[Sales] ),
Min ( Msr[MsrId] ) = 2,
Sum ( Fct[Quantity] ),
Min ( Msr[MsrId] ) = 3,
Sum ( Fct[Profit] )
)
This measure will check the value of the MsrId column, and then use the appropriate measure. However, it should be noted that when there are more than one value of MsrId (or if more than one measures are selected), only the measure having minimum value of MsrId would be displayed. So how will we display more than one measures on the pivot table? Read on.
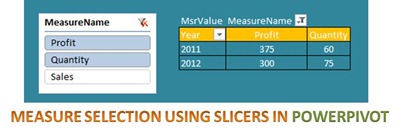
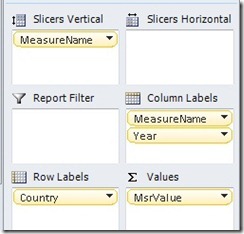
3) With this very simple setup, we are ready to view the results in the Pivot table. Drag and drop MeasureName column into the Slicer, Year into the Column Labels and Country in the Row Labels. Then drag and drop MsrValue in the Values and we should have something similar to the image below. I have also included the fact rows above the pivot so that we can compare.
Now there are a couple of problems with this pivot table. You would have noticed that the pivot table works correctly if only one measure is selected, but if there are more than one selections for the measure name, it will only show the measure with the minimum of the MsrId (eg, Sales in the image above). Also, we would like to see the name of the measure in the column above for clarity. To solve both of these problems, follow the next step.
4) Just drag and drop the MeasureName column in the Column Labels above the Year.
Now you can see that multiple measures are displayed and also that the measure names are displayed in the column above.
You can also change the formatting of the measures if needed
MsrValue:=switch (TRUE,
Min ( Msr[MsrId] ) = 1,
FORMAT ( Sum ( Fct[Sales] ), "$#,#0" ),
Min ( Msr[MsrId] ) = 2,
format ( Sum ( Fct[Quantity] ), "#,#0" ),
Min ( Msr[MsrId] ) = 3,
format ( Sum ( Fct[Profit] ), "$#,#0" )
)
Luckily, that wasn’t as hard as I thought (which means that I could still use my evening free time to focus on more important problems like whether the chicken or egg came first into the world!). If you don’t have such important problems to focus on like me, you can download the completed file from this link and test it out on your own!
 | Jason has been working with Microsoft BI tools since he joined the IT industry in 2006. Since then he has worked across SSAS, SSRS and SSIS for a large number of clients like Unilever, Imperial Tobacco, IATA, Schneider Electric, etc. He is currently working at MindTree Ltd, Bangalore (www.mindtree.com) and his personal blog site can be found at http://www.sqljason.com His blogs can also be found at the popular technical site BeyondRelational.com at http://beyondrelational.com/blogs/jason |


