Comments And Descriptions In DAX
Reposted from Chris Webb's blog with the author's permission.
With my Technitrain hat on I'm sitting in on Marco's Advanced DAX course in London today, and the question of comments in DAX came up - which reminded me that this is something I've been meaning to blog about. DAX as a language supports comments, but unfortunately it's not possible to add comments inside a DAX measure or calculated column expression in either PowerPivot or SSAS Tabular right now (which is where they're most needed – I hope this changes in the future). That said, there are some other things you can do to add textual explanations and descriptions to your DAX measure code.
Before we get onto the workarounds, a quick word about comments in DAX. These can only be used in DAX queries, and the types of comment supported are the same as in MDX: double-dashes and double-forward-slashes for single line comments, and forward-slash-asterisk to start a multi-line comment and asterisk-forward-slash to close a multi-line comment. Here's an example:
--single line comment
//another single line comment
/*a multi-line
comment*/
evaluate table1
What can be done with measures though? After all, that's where the most complex DAX is usually written.
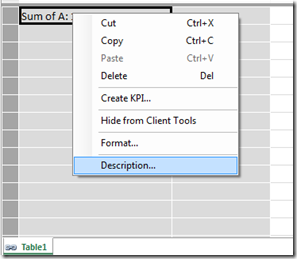
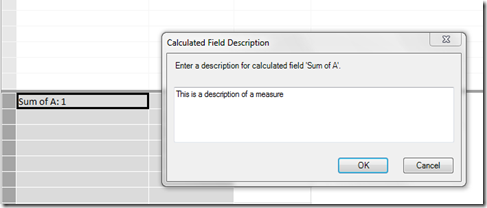
First of all, you can add a description to a measure by right-clicking on it in the measure grid and selecting Description:
Unfortunately this description is not easily accessible to end users anywhere (it would be great if it appeared as a tooltip in a PivotTable, for example) but it can be seen in an Excel worksheet by running a DMV query. DMV queries can be run in Excel 2013 in the same way as DAX queries, using a query table as described here; the DMV query to use is:
select measure_name as [Measure Name], [description], measure_is_visible
from $system.mdschema_measures
Unfortunately all hidden and implicit measures are returned, and even when the table is filtered so that only measure_is_visible=true there are still a lot of measures that probably shouldn't be shown.
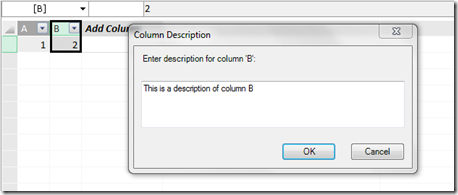
Similarly, descriptions can be added to any column (calculated or not) in your model, again by right-clicking on it and selecting Description.
This description can be displayed in the worksheet using the following DMV query:
select hierarchy_name as [Column Name], [description] as [Description]
from $system.mdschema_hierarchies
where cube_name='model'
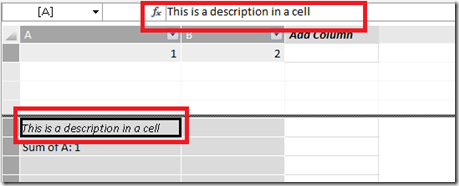
You can also write text direct to cells in the measure grid too. When I first saw a customer do this I was worried that it might not be supported, but I've been told that it is; so long as you don't use the =: used for defining measures then you should be ok.
This is probably the best way to add comments to your code, if only because it's the most visible to anyone looking at your PowerPivot/SSAS Tabular model. Of course, for it to be effective you'll need to have a system for arranging your measures in the measure grid; in "SQL Server Analysis Services 2012: The BISM Tabular Model", Marco, Alberto and I recommended that you arrange all your measures in the top-left hand corner of the measure grid and I think that's still a good idea, but the use of text in cells to create headings for groups of measures as well as descriptions can help a lot too.
 | Chris has been working with Microsoft BI tools since he started using beta 3 of OLAP Services back in the late 90s. Since then he has worked with Analysis Services in a number of roles (including three years spent with Microsoft Consulting Services) and he is now an independent consultant specialising in complex MDX, Analysis Services cube design and Analysis Services query performance problems. His company website can be found at http://www.crossjoin.co.uk and his blog can be found at http://cwebbbi.wordpress.com/ . |
Tags: dax


