Using PowerPivot to analyze web access log in "Combined Log" format (CLF)
User Rating: 5 / 5

Introduction
Majority of people who have a website or publish a blog wants to know how many people are visiting your site and what are they reading. There are few free services (like Google Analytics) that provide that information, but these free services have limitation - they usually provide just "human" visitor information. That is they track visitors who accessed your site from different browsers (PC, smart-phone, etc.) and triggered Java script execution. But sometimes you need to know more - you want to know ALL visits to your site - from humans and from bots (or robots). That information is accessible just from your web service log. If your web server is running on Apache (Unix), then it is very likely that your site has access log in "common log" format or in "combined log" format. Website access log can contain thousands or even millions of records and you need a tool that would help you to read and analyze them.
This article will demonstrate how easy is to create PowerPivot application that will create multiple helpful reports from website access log stored in Combined Log Format (CLF). We assume that you have at least basic knowledge on how to do simple things in PowerPivot (like loading data, create linked table, creating relationships, etc.), so we will not provide step by step guide on how to do these things.
Combined Log Format (CLF) description
In CLF each line contains 9 fields separated by space:
- IPAddress - IP address from where request was mad
- identd - Identity of the client. Not really useful for Internet log.
- userid - UserID of the person. Not really useful for Internet log.
- time - The time that the server finished processing the request.
- Request - The request line from the client.
- Status - Status code for request.
- SizeInBytes - Size of the object returned to the client.
- Referer - Site that referred client's request.
- UserAgent - This is the identifying information that the client browser reports about itself
Here is sample line from access log:
66.249.67.7 - - [30/Sep/2010:05:06:53 -0700] "GET /analysis-services-implementations/68-live-demos/1088-microsoft-sql-server-2008-data-mining-services-table-analysis-tools-for-the-claud HTTP/1.1" 200 29012 "-" "Mozilla/5.0 (compatible; Googlebot/2.1; +http://www.google.com/bot.html)"
You can read more about CLF here.
Loading log data into PowerPivot
When loading web access log into PowerPivot, you should be aware of following:
- Because IP address field looks like numeric value, PowerPivot will try to load it as float type field. This is not what we want, so we should tell PowerPivot that we want to load this field as text
- Date format used in web access log is not supported by PowerPivot. Date is in the brackets and there is space between part of dates (remember that for this file space is treated as column separator). So it is best to import date field as two separate text fields. From the example above field values would be "[30/Sep/2010:05:06:53" and "-0700]". Then in PowerPivot we will create calculated columns to convert string values to date/time values.
- SizeInBytes column sometimes can have value "-" which really means 0. Because of that we should import this field as text and then later convert it into integer.
- Other text fields are embedded in double quotes and PowerPivot handles that properly by default.
As we want to have control on how web access log data is imported by PowerPivot we will use schema.ini file where we will specify each field.
So lets start loading our log file data into PowerPivot:
- Copy your log file to folder and rename it to have extension txt, for example: ssas-info.txt
- In the same folder where you have your log file create new file schema.ini with content:
[ssas-info.txt]
Format=Delimited( )
ColNameHeader=False
MaxScanRows=0
Col1=IPAddress Text
Col2=ClientUserName Text
Col3=AuthUserName Text
Col4=LogDate1 Text
Col5=LogDate2 Text
Col6=Request Text
Col7=Status Text
Col8=SizeBytes Text
Col9=Referer Text
Col10=UserAgent Text
---- End of schema.ini file. Do not copy this line or lines below
Edit above file and replace first line "[ssas-info.txt]" with the name of your log file.
In the second line (Format=Delimited( ) ) we specified that field delimiter is space character. Then we listed each column and specified its name and type. Each field we load has type Text.
- Start Excel and then Start PowerPivot window.
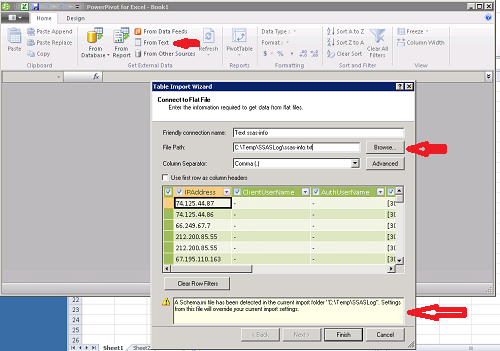
- From PowerPivot window area"Get External Data" choose "From Text".
- In "Table Import Wizard" window specify "File Path:" for your log file. You can ignore all other fields.
- As soon as you specified web access log file, you will see preview of your log and at the bottom part of the dialog box you will see message:
A Schema.ini file has been detected in the current import folder "<your folder location>". Settings from this file will override your current import settings.
- After you click on "Finish" button, PowerPivot will start loading your access log data. In our environment it took about 3 minutes to load 2.1mln records. In our case table that we loaded is called "ssas-info" (this name will be referenced in calculated measure definitions).
- Now you have your access log in PowerPivot.
- Status column in our table contains just numeric value (200, 404, etc.). We can create excel table that contains list of most popular http access status codes and load this table as linked table into PowerPivot and join to our access table based on status column. List of status codes can be found here. In our environment we loaded following status codes:
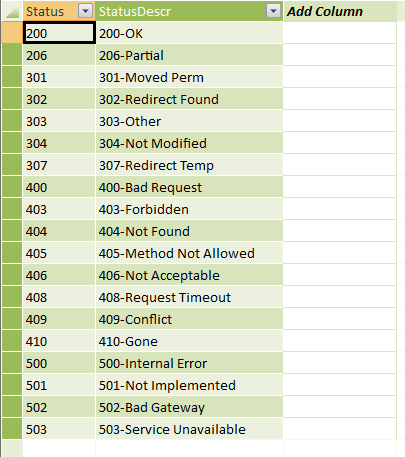
Note: After loading this table into PowerPivot we should create relationship between our web log table and this status table on field Status.
- Now we have all our data in PowerPivot and we are ready to prepare it for analysis.
Creating calculated PowerPivot columns
At this point we need to prepare web log access data for analysis:
- Fields UserAgent and Request can be very long, so we need to have shorter version of these fields (using just first x characters)
- Field SizeBytes should be converted to integer and we would like to actually calculate field SizeMB
- We need to parse UserAgent field to identify different applications that made requests and then create another field that groups these applications
- We need to parse date/time field and create parts of date/time that could be used in our analysis.
To fulfill above requirements we will create PowerPivot calculated columns using following DAX:
=RELATED('Status'[StatusDescr])
|
Column Name |
DAX formula |
Description |
| UserAgentShort |
=LEFT([UserAgent],100) |
Short version of UserAgent field |
| Hour | =LEFT(RIGHT([LogDate1],8),2)*1 | Request hour |
| Day | =LEFT(RIGHT([LogDate1],20),2)*1 | Request day |
| Month | =LEFT(RIGHT([LogDate1],17),3) | First 3 characters of the month name |
| SizeMB | =IfError([SizeBytes]/1024/1024,0) (sometimes value can be "-") |
Size of request in Megabytes, float type |
| Year | =LEFT(RIGHT([LogDate1],13),4)*1 | Request Year |
| Second |
=RIGHT([LogDate1],2)*1 | Request Second |
| Minute |
=LEFT(RIGHT([LogDate1],5),2)*1 | Request Minute |
| App |
=IF(SUBSTITUTE([UserAgent], "compatible; MSIE","") <> [UserAgent],"MSIE" |
Requested application. We extract this information from UserAgent by searching for known substring values. |
| AppGroup |
=IF([App] = "MSIE" || [App] = "Chrome" || [App] = "Firefox" || [App] = "Android" || [App] = "Smartphone" || [App] = "Opera" || [App] = "Macintosh" , "Browser" , IF([App] = "Yahoo" || [App] = "Googlebot" || [App] = "GoogleToolbar" || [App] = "msnbot" || [App] = "dotbot" || [App] = "exabot" || [App] = "yandex" || [App] = "spbot" || [App] = "magpie" || [App] = "Other Bot" || [App] = "Other Bot" || [App] = "Other Bot" , "Bot" , IF([App] = "Feedburnder" || [App] = "RSS" , "RSS" , "Other" ) ) ) |
Application Group. We create application groups "Browser", "Bot", "RSS" and other to identify applications that made request. |
| StatusDescr | HTTP access status code with description. |
Calculated column "App" deserves special explanation. In this column formula we are searching for different substrings in the UserAgent field and based on the fact if that substring is found we assign application name. Normally you would write following DAX formula to check if a string contains specific substring:
IF(IFERROR(SEARCH("<SubstringToFind>",[UserAgent]),0)<>0,<AppNameIfFound>,<AnotherSearchIfNotFound>)
But we used following DAX logic to check if substring exist:
IF(SUBSTITUTE([UserAgent], "<SubstringToFind>","") <> [UserAgent],<AppNameIfFound>,<AnotherSearchIfNotFound>)
In our formula we avoided using IfError DAX function that is known to have performance issues. Performance here is very important to us, because calculation of this column is very slow. Please note that even after all performance tuning it takes about 3.5min for this column to be calculated.
As we created calculated columns, some of the base columns now can be hidden from Pivot view. We can do that using PowerPivot option Design->Hide and Unhide". Image below shows columns we can safely hide:
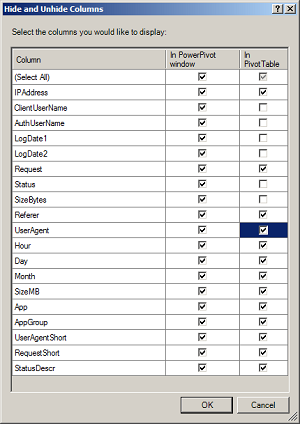
For table "Status" we can hide all columns "In PivotTable", as we created calculated column StatusDescr in our main web access log table. When we hide all columns in table, that table will not appear in PivotTable field list view.
At this point we should create our first Pivot table and add to our application few calculated measures that will be used in different reports
| Measure Name | DAX Formula | Description |
| RecordCount | =COUNTROWS('ssas-info') | Record count |
| IPDistinctCount | =COUNTROWS(DISTINCT('ssas-info'[IPAddress])) | Count of Distinct IP addresses |
Now we are ready to create reports based on data we just loaded.
Analyzing web log data
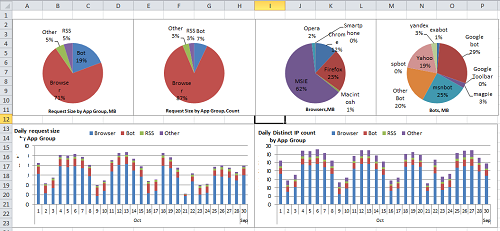
It took some time for us to load data into PowerPivot and prepare it, but now we have full flexibility to analyze our web stats data. Here is sample dashboard that helps me understand what applications are downloading data from my website and how much (note some numbers are masked)
And here is example of report that shows request counts by http status codes:
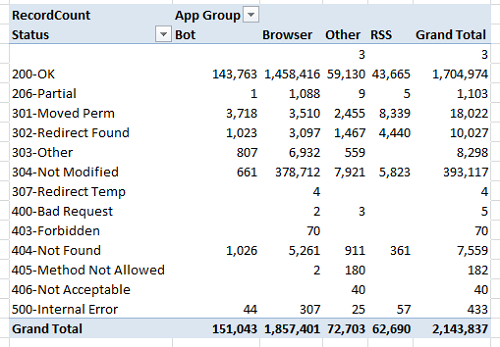
There are many other reports that can be built from this access log and it all depends on what would you like to analyze and how good you are with carts and pivots. And just like we added Status table, for your reports you might want to include additional information that would help you analyze your web access log. For example, if you have a local store database, you might want to add weather information to your analysis to see how it affects web traffic. Or you might consider buying IP address geolocation information and incorporate that in your analysis.
Summary
PowerPivot is extremely powerful tool that can be used to analyze millions of rows of data. It allows us to build applications with a very few lines of code (DAX scripting) that can be easily expanded by adding data from other sources (like we did with status code description). Any time you are dealing with data and want to understand it better, you should consider using free tool - PowerPivot.