DAX Queries, Part 2
Reposted from Chris Webb's blog with the author's permission.
Following on from my last post, let’s now see how we can do group-by style in DAX queries.
The key to aggregating data is the Summarize() function, which is broadly similar to a Group By in SQL. So if the following query returns every row from the FactInternetSales table:
evaluate(
FactInternetSales
)
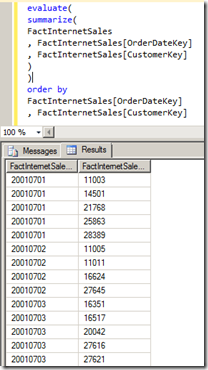
The following query just returns a list of all the distinct combinations of values from the OrderDateKey and CustomerKey columns:
evaluate(
summarize(
FactInternetSales
, FactInternetSales[OrderDateKey]
, FactInternetSales[CustomerKey]
)
)
order by
FactInternetSales[OrderDateKey]
, FactInternetSales[CustomerKey]
Once we’ve specified the name of the table in the first parameter of Summarize, we can then supply a list of columns in the table to group by. This list can contain any number of columns, but we can also do aggregations inside Summarize by supplying a list of column names and DAX numeric expressions after the list of columns. So, for example:
evaluate(
summarize(
FactInternetSales
, FactInternetSales[OrderDateKey]
, “Sum of Sales”
, Sum(FactInternetSales[SalesAmount])
, “Distinct Customers”
, DistinctCount(FactInternetSales[CustomerKey])
)
)
order by
FactInternetSales[OrderDateKey]
Gives us the sum of the SalesAmount column and the number of distinct values in CustomerKey, for each distinct OrderDateKey value, as extra columns in the resultset.
We can also reference columns from related tables in our aggregations. So for example this query uses the DimDate table and gives us data aggregated up by year:
evaluate(
summarize(
DimDate
, DimDate[CalendarYear]
, “Sum of Sales”
, Sum(FactInternetSales[SalesAmount])
, “Distinct Customers”
, DistinctCount(FactInternetSales[CustomerKey])
)
)
order by
DimDate[CalendarYear]
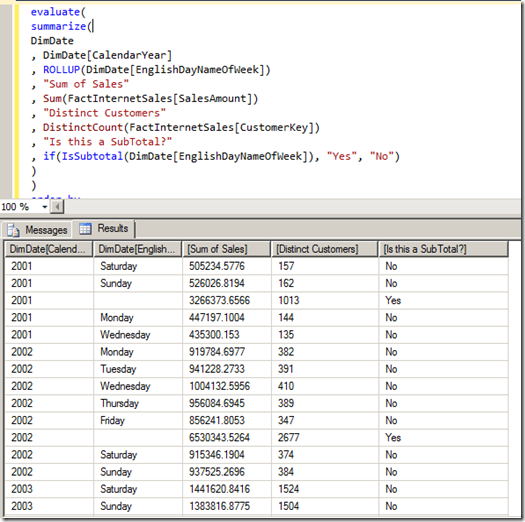
Finally (at least for today), we can do subtotalling by using the Rollup() function inside our list of group by columns; each column we list inside Rollup() will work like a regular group by column but it will also have a subtotal row added for it in the resultset. So here, for example, is the query above with an extra group by on the days of the week:
evaluate(
summarize(
DimDate
, DimDate[CalendarYear]
, ROLLUP(DimDate[EnglishDayNameOfWeek])
, “Sum of Sales”
, Sum(FactInternetSales[SalesAmount])
, “Distinct Customers”
, DistinctCount(FactInternetSales[CustomerKey])
)
)
order by
DimDate[CalendarYear]
I’ve highlighted the subtotals rows here, but we can also identify these rows using the new IsSubTotal() function:
evaluate(
summarize(
DimDate
, DimDate[CalendarYear]
, ROLLUP(DimDate[EnglishDayNameOfWeek])
, “Sum of Sales”
, Sum(FactInternetSales[SalesAmount])
, “Distinct Customers”
, DistinctCount(FactInternetSales[CustomerKey])
, “Is this a SubTotal?”
, if(IsSubtotal(DimDate[EnglishDayNameOfWeek]), “Yes”, “No”)
)
)
order by
DimDate[CalendarYear]
 |
Chris has been working with Microsoft BI tools since he started using beta 3 of OLAP Services back in the late 90s. Since then he has worked with Analysis Services in a number of roles (including three years spent with Microsoft Consulting Services) and he is now an independent consultant specialising in complex MDX, Analysis Services cube design and Analysis Services query performance problems. His company website can be found at http://www.crossjoin.co.uk and his blog can be found at http://cwebbbi.wordpress.com/ . |


