Detail level reporting with DAX
Reposted from Chris Webb's blog with the author's permission.
One widely-acknowledged weak spot of Analysis Services and MDX today is that, while the performance of queries showing a small number of rows and aggregated values is usually very good, performance can be bad when you’re reporting on detail-level data and returning a potentially large number of rows. This is due to a number of different reasons (such as the often poor MDX generated by tools like Excel, the fact you have to crossjoin many hierarchies together and then do a NON EMPTY for this kind of report, the fact that you may need to use ROLAP storage for very large hierarchies, and so on), and although matters have improved over the years and there are workarounds for many of these issues, I’d say it’s one of the main reasons that the concept of the Unified Dimensional Model (ie ‘one reporting model to rule them all’) never caught on – some types of reports were always going to be easier to write and faster to execute in SQL than in MDX.
Of course now we have UDM v2.0 in the shape of the ‘BI Semantic Model’ and the Tabular Model the question of detail-level reporting rears its head again. We won’t be able to say whether performance for these queries is good enough in the Tabular Model until RTM because we can expect a lot of tuning and bug-fixing will go on between now and then, but several things already suggest that DAX has several advantages over MDX for detail reporting:
- Anecdotal evidence suggests that detail-level queries going against the same Tabular model are faster when written in DAX than in MDX.
- DAX as a language is much better suited to detail-level reporting: as I showed in my recent series on DAX queries, filtering, subtotalling and pagination are all much easier in DAX than in MDX.
- DAX queries return columns that are typed, whereas the columns that are returned from an MDX query are usually interpreted as text, strings or variants. This makes DAX queries much easier to work with in tools like SSRS where you might want to do calculations or filtering in the reporting tool rather than the query.
However, out of all Microsoft BI tools only Crescent will natively speak DAX when Denali is released – Excel pivot tables will still, of course, be generating MDX in the background and I guess there won’t be a new DAX query builder for traditional SSRS reports as far as I know. That doesn’t mean we can’t use DAX in Excel and SSRS though…
The tricks discussed here can be used to create an Excel table bound to a DAX query; in particular it’s very easy to use the method Greg Galloway came up with of creating a pivot table, double-clicking on a cell to drillthrough, then editing the query behind the new table to use a DAX query. Parameterisation requires a bit of VBA coding but that’s not difficult to do; and of course in many cases it may be sufficient to write a non-parameterised query, bind it to a table and let the native Excel functionality do the rest.
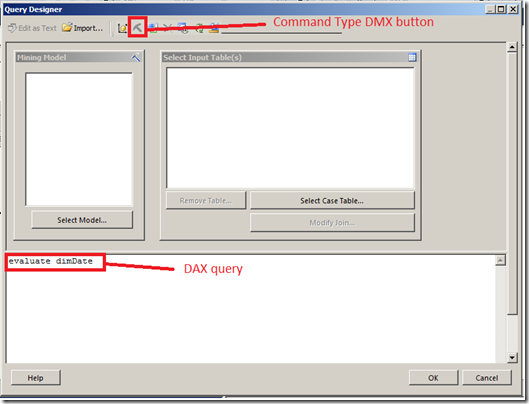
For SSRS, you have two options. You can use the Analysis Services connection type but in CTP3 at least you can’t enter a DAX query in the MDX editor – you get an error. Greg came to my rescue once again though by pointing out that you can get DAX queries to run by clicking the “Command Type DMX” button in the query designer (in the same method you need to use to get an MDX Drillthrough statement to run):
The only drawback with this approach is that the columns in the dataset don’t come back typed in SSRS. The alternative is to use an OLEDB connection to Analysis Services instead (see here for how to do this for an MDX query – the steps are the same for using a DAX query in an OLEDB dataset). If you do this the columns do come back typed but you can no longer parameterise your query directly; you need to generate your DAX query using a dynamic expression if you want to parameterise it which is a royal pain to do.
So not ideal but I think for SSRS at least the benefits of using DAX for reporting outweigh the disadvantages. Even for those people for whom Crescent is not an option because of the Sharepoint dependency, but who want to do a mixture of traditional ad-hoc analysis and detail-level reporting, I suspect that using the Tabular model and DAX plus Excel and SSRS might be a better choice than the Multidimensional model in many cases.
 |
Chris has been working with Microsoft BI tools since he started using beta 3 of OLAP Services back in the late 90s. Since then he has worked with Analysis Services in a number of roles (including three years spent with Microsoft Consulting Services) and he is now an independent consultant specialising in complex MDX, Analysis Services cube design and Analysis Services query performance problems. His company website can be found at http://www.crossjoin.co.uk and his blog can be found at http://cwebbbi.wordpress.com/ . |
Tags: performance, dax

