Q: How can I see what internal commands PowerPivot executes in its engine?
Q: How can I see what internal commands PowerPivot executes in its engine?
A: To see what internal commands (XMLA, MDX, etc) PowerPivot executes behind the scene in it engine, you should enable PowerPivot trace and then review it.
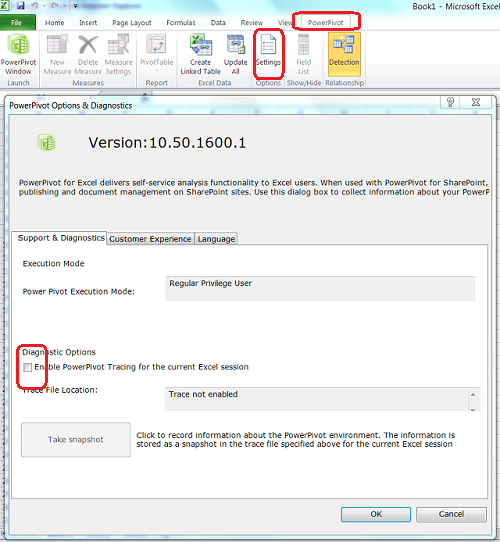
Start Excel and go to PowerPivot menu and then click on the "Settings" button. New window will pop up "PowerPivot Options and Diagnostics". At the bottom of this screen you will see a check-box "Enable PowerPivot Tracking for the current Excel session".

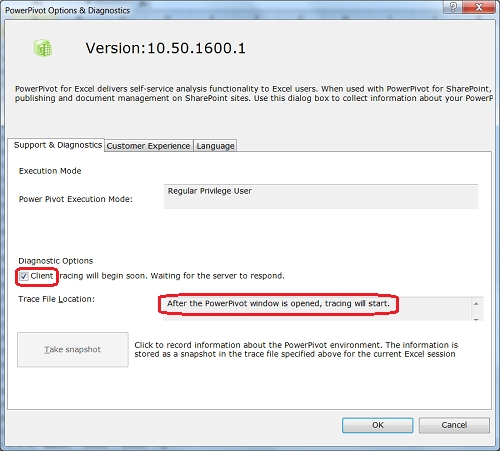
As soon as you click on that check-box, you will get a warning "After the PowerPivot window is opened, tracing will start":

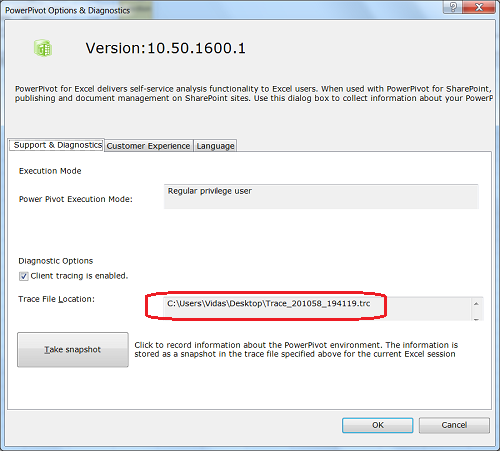
After you will click OK, you will notice that "Trace File Location" property in the "PowerPivot Options & Diagnostics" window changed, but it is not specified yet:

Now close "PowerPivot Options & Diagnostics" window and open PowerPivot window. From this point anything you will do in PowerPivot will be recorded in the PowerPivot trace. To see trace file name go back to "PowerPivot Options & Diagnostics" screen. At this point "Trace File Location" property now should show where PowerPivot trace file is saved.

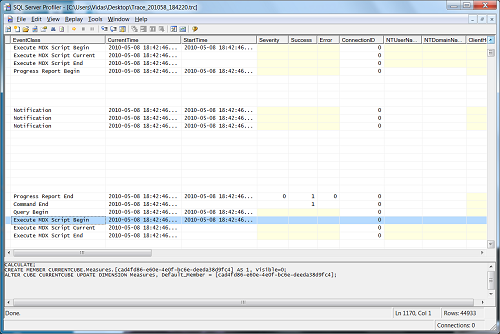
Remember this trace file location. By default PowerPivot traces are stored on users desktop. This trace file is intended for Microsoft technical support, but you can open it using Microsoft SQL Server 2008 R2 Profiler and review executed statements. Results look very similar to Microsoft SQL Server Analysis Services (SSAS) trace.

If you will load PowerPivot workbook after trace file is started, it will record XMLA commands to create PowerPivot (that is SSAS) cube and then all commands executed against that cube - for example statements to count records in tables, etc.
PowerPivot tracing is enabled per sessions - that is if you will close Microsoft Excel workbook and re-open it again, PowerPivot tracing will not be running unless you enable it again. To stop PowerPivot trace you should close Excel workbook.
