Self-Service BI Mapping with Microsoft Research’s Layerscape–Part 1
Reposted from Chris Webb's blog with the author's permission.
Sometimes you find a tool that is so cool, you can’t believe no-one else has picked up on it before. This is one of those times: a few month or so ago I came across a new tool called Layerscape (http://www.layerscape.org) from Microsoft Research which allows you to overlay data from Excel onto maps in Microsoft WorldWide Telescope (http://www.worldwidetelescope.org). “What is WorldWide Telescope?” I hear you ask – well, it’s basically Microsoft Research’s answer to Google Earth, although it’s not limited to the Earth in that it also contains images of the universe from a wide range of ground and space-based telescopes. It’s a pretty cool toy in its own right, but Layerscape – which seems to be aimed at academics, despite the obvious business uses – turns it into a pretty amazing BI visualisation tool.
Layerscape is very easy to use: it’s an Excel addin, and once you have it and WWT installed all you need to do is select a range of data in Excel to be able to visualise it in WWT. For some cool examples of what it can do, take a look at the videos posted on the Layerscape website like this one (Silverlight required):
http://www.layerscape.org/Content/Index/384
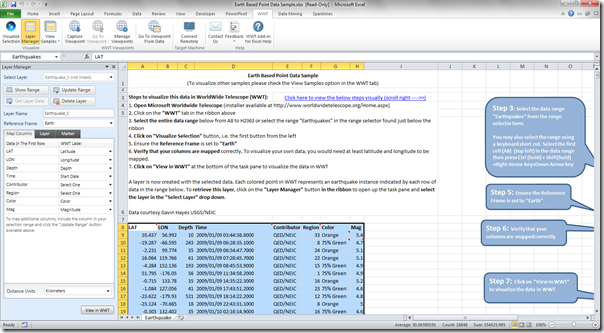
Here are some screenshots of two sample datasets that come with Layerscape. First, here’s some data on earthquakes in Excel with the Layerscape addin open:
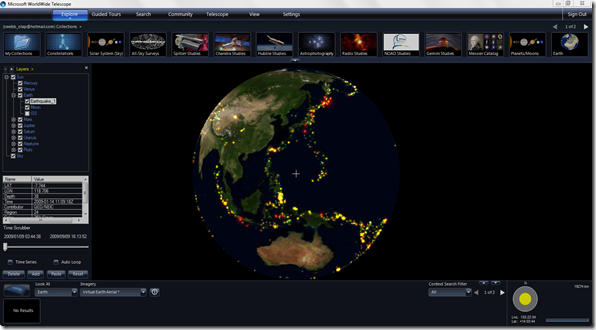
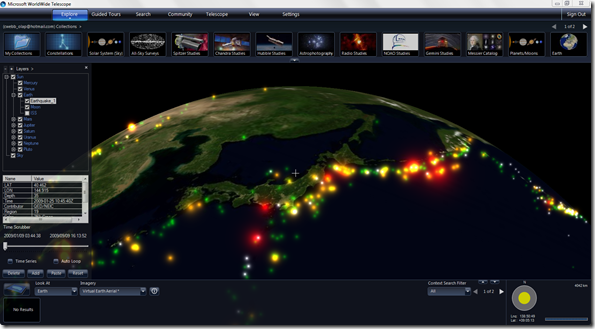
Here’s an example of what this looks like visualised:
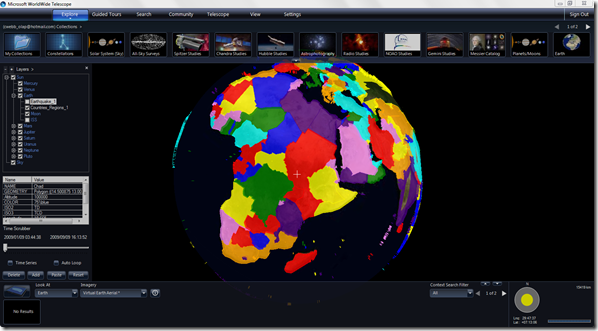
Here’s a second dataset with polygon data for the outlines of the countries of the world:
Now maybe you don’t have any really sexy scientific data to explore, but it’s increasingly likely that a business will have spatial data that needs visualising somehow. There are no end of ways this is possible in the SQL Server BI stack (here’s a good post by Alex Whittles about using maps in SSRS for example) but I think the most exciting thing about a tool like Layerscape is that it’s so easy to use that most reasonable competent, non-technical Excel users would have no trouble with it; also, because it integrates with Excel, it also plays nicely with PowerPivot.
Here’s a simple example of how to get data from PowerPivot into Layerscape. Let’s start with a dataset I found courtesy of this post on Alastair Aitchison’s superb spatial data blog:
http://alastaira.wordpress.com/2012/02/20/load-garmin-poi-data-to-sql-server/
Let’s imagine you’re a tourist visiting the UK – perhaps you’ve come over for SQLBits and you want to see some sights while you’re here. If you like castles and stately homes you might want to visit a National Trust property: the National Trust owns and protects over 500 historic buildings in England, Wales and Northern Ireland. How can we find out where these properties are?
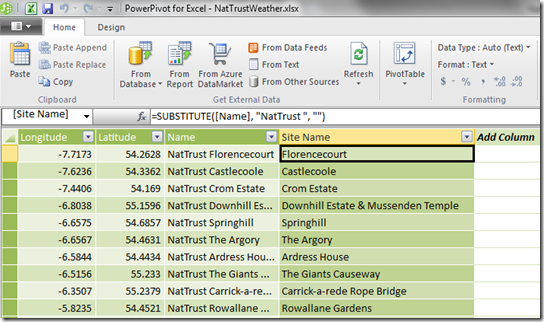
Using one of the datasets listed in Alastair’s post above, I downloaded a CSV file containing the names, latitudes and longitudes of all the National Trusts properties and imported it into a table in PowerPivot. The data’s very simple: just a latitude, longitude and a site name, and the only cleanup I did was to create a new calculated column that removed the string “NatTrust” from the beginning of each site name:
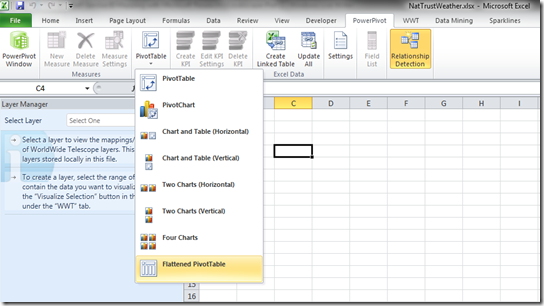
Then on a blank sheet in Excel I created a new flattened PivotTable:
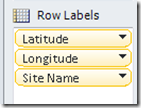
Added the Latitude, Longitude and Site Name columns onto rows:
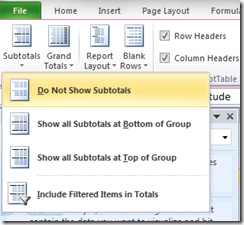
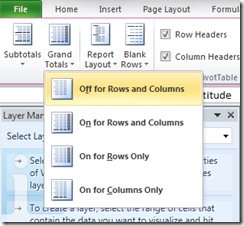
Turned off subtotals and grand totals on the PivotTable:
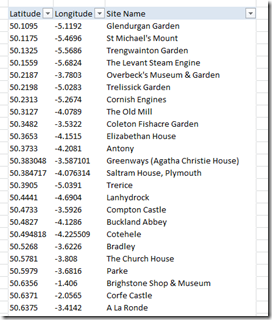
And ended up with a PivotTable that looked like this:
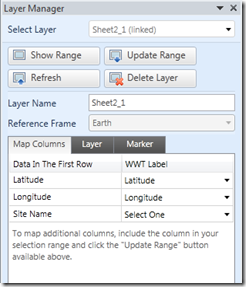
All I then needed to do was select the whole table, right-click and choose “Visualize in WWT”, then in the Layer Manager pane ensure the Latitude and Longitude columns were all mapped correctly:
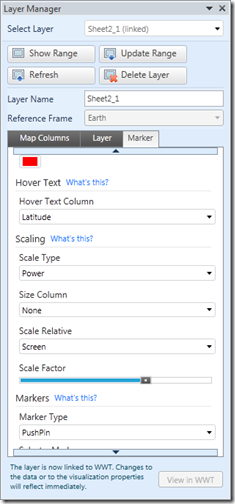
And change the following properties on the Marker tab: Scale Type to Power, Scale Factor to 16, Scale Relative to Screen and Marker Type to Pushpin.
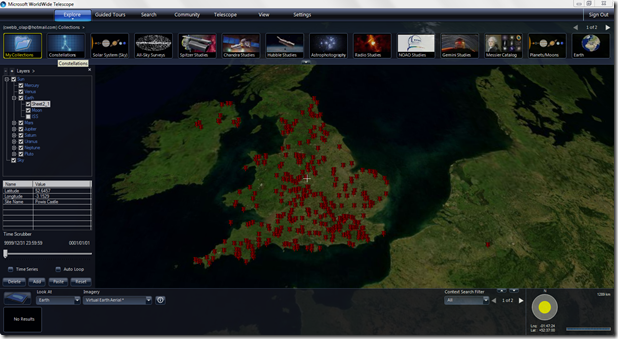
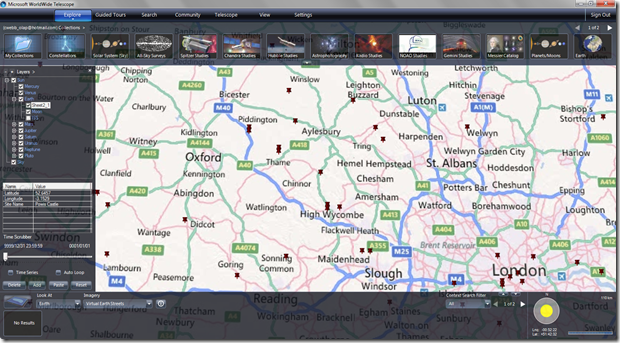
Then finally click on the View in WWT button at the bottom of the Layer Manager pane to push the data over to WWT. Here’s the result with all the National Trust properties plotted on a map:
Of course the problem with visiting a National Trust property is that you won’t be able to do much outdoors if it’s raining. I wonder where I can get some weather data and add that to my map? We’ll find out how in part 2…
 |
Chris has been working with Microsoft BI tools since he started using beta 3 of OLAP Services back in the late 90s. Since then he has worked with Analysis Services in a number of roles (including three years spent with Microsoft Consulting Services) and he is now an independent consultant specialising in complex MDX, Analysis Services cube design and Analysis Services query performance problems. His company website can be found at http://www.crossjoin.co.uk and his blog can be found at http://cwebbbi.wordpress.com/ . |

